I recently became quite interested in the correlation between type and popularity. (in the social sense of the word) After mulling the concept over, I decided to search online for some information on the topic. I found that the web is rampant with self discovery blogs and online articles, that stress the bias of western culture towards favouring the extravert over the ‘misunderstood’ introvert. However these topics lacked depth, and soon lost my interest. I decided that to find the information I was searching for, I needed to gather the data required on my own. I came to the conclusion that the best measure of popularity was an individual’s subjective opinion, and that the best test of popularity is the social jungle of high school. Considering that it is where most develop, and learn to adapt to those around them. I soon began to collect my data from various online communities focused on personality typology, and compiled the information accordingly. The following is the result of my informal study.
“On a scale of one through to ten, how popular do you think you were in high school? (one indicating social ineptness, and ten meaning the most popular in class) Please state your type.”
The first finding in the data was the link between temperament and popularity.
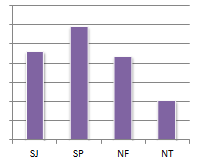
The greatest popularity was attributed to the SPs. Despite the lower ratings of ISFPs, the other Artisan’s rankings were typically above average, indicating their ability to keep up with social norms. Even after eliminating two or so outliers, the SJs stayed consistently close to the SPs, most notably due to the high rankings of the ESTJs. Despite being somewhat below SJ standards, the NFs were the most consistent temperament – sustaining average popularity throughout the entirety of the study. However, despite the high rankings of ENTX types, the mean for the NTs was dragged down by the very low ratings of their INTX counterparts.
After exploring temperament, I moved onto the variables. I split the four groupings, and measured their popularity accordingly.
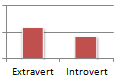
The variables of introversion and extraversion did in fact meet up to popular opinion, showing popularity to be favourable towards extraverts. This could be attributed to introverts scaling themselves lower, due to the ‘misunderstood’ stereotype placed upon them, however this is somewhat unlikely. Admittedly the data from this select group of applicants prove countless bloggers right, that being introverted will not gain you any popularity points, if not reduce them.

The sensing and intuition preferences showed a large discrepancy. Sensors considered themselves more socially inclined, while intuitives lacked such confidence. My reasoning for this is that sensors are more likely to be on the sports team earning their attention among peers, while intuitives on the other hand might be more interested in theatrical studies or music, trading their recognition for their passions

Thinking types scored somewhat higher than their feeling counterparts. A suggestion for the variance is that thinkers are generally more assertive than feelers, meaning that feeling types are more susceptible to bullying and becoming followers, as opposed to being leaders.
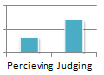
The popularity of judgers was significantly higher than that of perceivers, the biggest difference in average than any of the other variables. To evaluate this preference, requires me to draw on a major generalisation, so please take it for what it is. Typically, perceivers can be known to engage in more risky and unprecedented behaviours than judgers. In a high school setting, judgers could posses more social prowess, due to their evaluating and regimented thought processes.
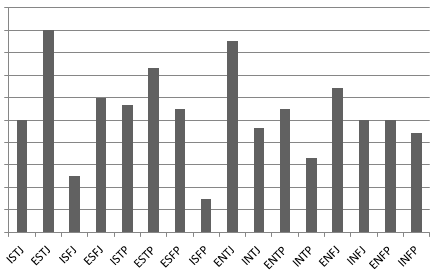
Now having looked into temperament and preferences, it’s time to delve into the popularity of individual types.

As can be noted in the above graph, ESTJs are perceived to be the most popular type. Interestingly enough, E-S-T-J makes up each of the most popular variables. So it can be concluded, that the closer a type is to being ESTJ, the more popular they will be. For example, the most popular type after ESTJ, is ENTJ, then ESTP and ESFJ. These three types each share two or more of the same variables as the ESTJ. However, this theory is not entirely sound. Considering that the opposite of an ESTJ is INFP, this logic should show them to be the least popular, but they are not. Instead, ISFPs are. This proves that not every type will consider themselves as popular as they realistically are, and in fact this data could also be a measurement of how each type views themselves too. Consider INFJs for example. INFJs are generally well liked, and are a fairly popular type in a social setting. However, due to their modesty and dislike for making a show of themselves, they will perceive themselves to be less popular than they are, out of respect or humility for other people. Therefore, although this study does show quite a strong correlation between type and popularity, it can also show a link between type and degree of self-absorption, to make one assumption out of many.
As I am putting this study forward, I feel the need to defend my position, and state the validity of the data I have used. The following is a list of factors that could cause the data to be bias:
- A lower amount of responses from sensing types
- The majority of results were compiled from various online typology communities
- The results are subjective
- The data originates from many countries and cultures
- This is an informal study
To conclude the post, I would like to state that I have attempted to refrain from making any major assumptions of the data, and have tried to provide the information as impartial as possible. I would like to thank the 100+ people who volunteered their results, specifically those from the NFGeeks Facebook Group and Personality Cafe. As well as my personal friends who I called on when I was lacking data for the under represented sensing types.
If you have enjoyed this study please share it and recommend to your friends, and if you have any questions or suggestions be sure to leave a comment.